Key Takeaways
- Both 1-hour and 1-day charts offer valuable insights for crypto trading when used appropriately for your specific trading strategy and timeframe.
- 1-hour charts excel at identifying short-term price movements, capitalising on intraday volatility, and providing optimal reference points for day trading and scalping strategies.
- 1-day charts are superior for filtering out market noise, establishing long-term trends, and providing more reliable support/resistance zones for better risk management.
- Multiple timeframe analysis combines both charts effectively—use daily charts to identify the overall market direction and hourly charts to pinpoint optimal entry points with tighter risk parameters.
- Common errors would include using mismatched time frames for trading objectives, over-trading within lower time frames, and applying the same indicators across time frames without changing them.
When I first started trading crypto, I remember being forced to ask a foundational question that people new to trading struggle with. Should I trust the one-hour chart or the one-day chart? Now, after many years of trading crypto, I can say that the answer is – both! If we use them correctly, you will see that both one-hour one day (and other time frames) add value to the trader.
When I say use them correctly, I mean it does not matter if you use a one-hour or one-day chart as long as you understand the role of each in your trading plan. In my experience, I think the 1-hour charts suit day/trading and swing traders looking for predator gains in the short term, and, on the other side, the 1-day chart helps to show seasonal longer-term trends, and significant support/resistance levels that may be missed on lower time-frames. In my trading journey, I have learned that different time frames provide very different perspectives that complement each other much more than they compete with each other.
Understanding Time Frames in Crypto Trading Charts
Time frames are critical elements in crypto trading charts that significantly impact your trading decisions. They represent specific periods during which price movements are recorded and displayed on a chart. Each time frame offers unique insights into market behaviour and serves different trading objectives.
Why Time Frames Matter in Trading
Time frames create the foundation for technical analysis in cryptocurrency trading. Short time frames reveal immediate market reactions, while longer ones show established trends.I have learned that having good command of different timeframes has noticeably increased my ability to identify high probability trading opportunities.
Alex Kuptsikevich, a senior market analyst at FxPro, said, “Choose a timeframe that fits your style and level of risk. For example, for day traders, shorter timeframes may be the most applicable form of price chart. At the same time, investors may prefer daily, weekly, or monthly price charts to establish and develop a longer-term position. “
Common Time Frames Used by Traders
- 1-minute charts – Capture rapid price fluctuations, ideal for scalpers executing multiple trades within minutes.
- 5-minute charts – Provide slightly more context while still showing short-term volatility patterns.
- 15-minute and 30-minute charts – Balance detail with broader context, popular among day traders.
- 1-hour charts – Show significant intraday movements without excessive noise, perfect for swing trading setups.
- 4-hour charts – Highlight medium-term trends while filtering out minor fluctuations.
- 1-day charts – Display clear trend directions and major support/resistance levels for longer-term strategies.
- Weekly/Monthly charts – Reveal macro trends and historical performance patterns for investment decisions.
Matching Time Frames to Your Trading Strategy
Your trading timeline should dictate your chart time frame selection. For scalping and day trading, 1-minute to 1-hour charts work best. Swing traders typically rely on 4-hour to 1-day frames. I’ve personally achieved the most consistent results using 1-hour charts for entry signals while confirming trends on daily charts.
Advantages of 1-Hour Charts for Crypto Traders
Identifying Short-Term Price Movements
The 1-hour chart offers the ideal medium-term view for crypto traders who are interested in capitalizing on substantial price action. I have found that an hourly chart is generally best at identifying trends that last from hours to days. This timeframe fits perfectly with my swing trading strategy because it allows me to take advantage of predictable price action over shorter timeframes. Technical analysts often prefer 1-hour charts because they provide enough detail to spot emerging patterns without getting lost in market noise.

Capitalising on Intraday Volatility
1-hour charts provide the ideal balance between detail and noise reduction when tracking crypto market volatility. I can easily recognize candlestick patterns indicating potential reversals or trend continuations within the same trading day. Hourly charts have allowed me to react faster to sudden moves in price, and the analysis I have performed has been so much clearer throughout what would be a normal trading day. An hourly chart offers an accurate representation of price action without getting too wrapped up in detail by minute movements that can potentially give you false signals when trading on shorter time frames.
Optimal for Scalping Strategies
1-hour charts serve as excellent reference points for executing precise scalping strategies in the crypto market. I’ve successfully used these charts to identify key support and resistance levels that hold significance for shorter timeframes. The hourly view provides enough context to understand where the market might be heading while still allowing for quick entry and exit points. Many professional traders combine 1-hour chart analysis with shorter timeframes to confirm scalping opportunities that align with the hourly trend direction.
Benefits of 1-Day Charts in Cryptocurrency Analysis
Filtering Out Market Noise
1-day charts are exceptional at eliminating the short-term volatility that often clutters 1-hour timeframes. I’ve found that daily charts provide a much clearer picture of the market’s true direction by smoothing out minor price fluctuations. This reduction in noise has dramatically improved my trading decisions. When I’m bombarded with constant price movements on shorter timeframes, the daily chart acts as my compass, helping me see beyond momentary market reactions. Many professional traders rely on daily charts to avoid being misled by false breakouts that frequently appear on lower timeframes.
Establishing Long-Term Trends
The power of 1-day charts lies in their ability to reveal major market trends that typically last weeks or months. I utilize daily charts to determine major market price action structures like flags, triangles, and double-bottoms, which have been extremely beneficial for my long-term investment decisions. Daily charts are the overall encyclopedia of price action, so many traders like to rely on them as a primary method of displaying a comprehensive picture of price action to find the beginning and end of major or significant moving trends. “Daily charts are the best foundation for determining the health and direction of any market”, says market analyst Alex Kuptsikevich.

Better Risk Management Opportunities
Daily charts offer superior risk management capabilities compared to shorter timeframes. I’ve been able to set more effective stop-loss orders using daily support and resistance levels, which tend to be more reliable than those found on 1-hour charts. Today, my loss of false exits has been tremendously reduced during periods of regular market fluctuation. I find that daily charts enable traders to have a slower thought process when applied to price-action in volatile times, without the cognitive bias of any emotional mindsets to short-term price action movements. I find that daily price action helps you improve as a trader by creating a more disciplined trading mindset, favouring capital preservation while also enabling you to capture large moves in the market over time.
When to Trust 1-Hour Charts in Your Trading Strategy
Day Trading Scenarios
The 1-hour chart becomes invaluable when I’m executing day trading operations that require precise timing. I’ve found these charts perfect for short to medium-term trading strategies where capturing price movements over several hours is the goal. They provide that sweet spot between the chaotic noise of minute charts and the broader view of daily timeframes. For day traders like me seeking to capitalise on intraday movements, the 1-hour chart offers sufficient detail without overwhelming with excessive information.
Technical Pattern Recognition
I trust 1-hour charts when I need to identify technical patterns that develop over several hours rather than days. These charts excel at revealing head and shoulders formations, double tops, and flag patterns as they form in real-time. The clarity of these patterns on 1-hour timeframes has significantly improved my entry timing. According to Alex Kuptsikevich, senior market analyst at FxPro, “1-hour charts provide the ideal balance for technical pattern recognition without the false signals common in shorter timeframes.”
Volume Analysis Effectiveness
Volume analysis becomes remarkably effective on 1-hour charts when tracking institutional movement throughout the trading day. I can clearly see volume spikes that coincide with significant price moves, giving me confirmation of trend strength. These charts allow me to distinguish between genuine breakouts supported by increasing volume and fake-outs characterised by declining participation. The 1-hour timeframe captures enough trading activity to establish meaningful volume patterns while filtering out the minute-by-minute noise that can lead to misinterpretation.
When to Rely on 1-Day Charts for Better Decisions
Position Trading Approaches
Position trading with 1-day charts has transformed my crypto investment strategy. These longer timeframes allow me to spot genuine trends while filtering out market noise that often misleads short-term traders. I’ve found success using daily charts to identify assets with strong fundamentals for weeks or months-long holds. Position traders benefit from reduced screen time and lower trading frequency, which minimises both commission costs and emotional trading decisions. As noted by crypto analyst Alex Kuptsikevich, “Position traders using daily charts can capture the full market cycle while avoiding the psychological strain of monitoring minute-by-minute fluctuations.”
Market Cycle Identification
Daily charts excel at revealing broader crypto market cycles that remain hidden on shorter timeframes. I’ve successfully identified accumulation, markup, distribution, and markdown phases using 1-day charts across multiple bull and bear markets. These patterns help me determine optimal entry and exit points for maximising profits. Market cycles typically span months or years, making daily charts the perfect lens for spotting these valuable patterns. The rhythmic nature of crypto markets becomes clearer when viewing price action through the daily timeframe. Major shifts in market sentiment become obvious on 1-day charts, showing clear transitions between bullish and bearish phases.
Support and Resistance Zone Validation
The most reliable support and resistance zones emerge on daily charts through repeated tests over time. I’ve found these levels offer stronger validation than those appearing on 1-hour charts. Daily zones that hold through multiple tests indicate significant buyer or seller interest at those price points. When trading based on these validated zones, my stop-loss placements have become more effective with fewer false triggers. Daily timeframe support and resistance levels often align with key psychological price points where market participants naturally gravitate. These zones provide the foundation for my risk management strategy, allowing for more precise position sizing based on distance to invalidation points.
Combining Both Time Frames for Strategic Advantage
Using Multiple Time Frame Analysis
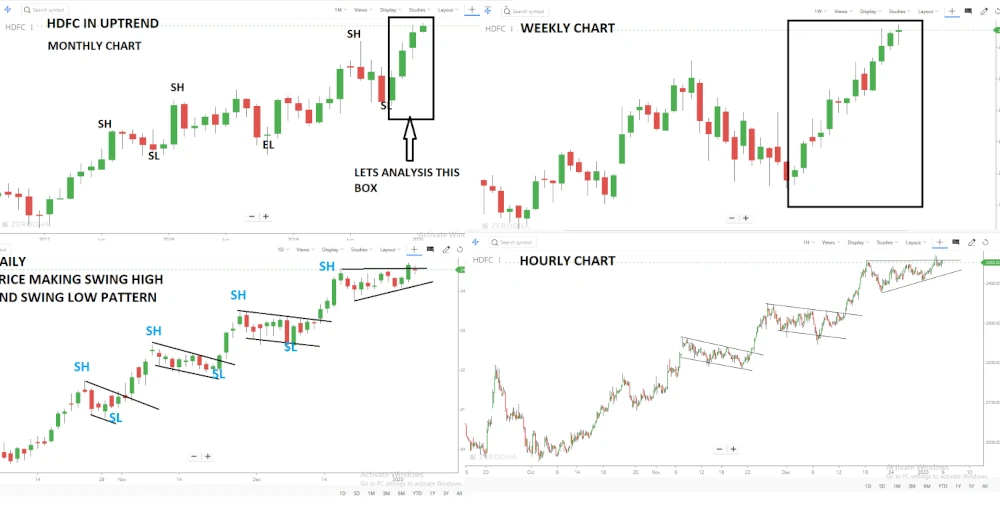
Multiple time frame analysis is a powerful crypto trading technique that examines the same asset across different time intervals. I like to begin with a 1-day chart to find the major market direction (bullish or bearish). The longer time frame allows you to see broader market sentiment that could be hidden in the shorter time frames. Meanwhile, the 1-hour chart serves as verification, confirming the strength and consistency of trends spotted on daily charts. This complementary approach provides a comprehensive market view that single-timeframe analysis simply cannot match.
Creating a Balanced Trading System
Successful crypto trading requires balance, using both 1-hour and 1-day charts. My first step is to identify the primary trend on the daily chart, which outlines the appropriate direction for my trades. This eliminates the risk of trading against the natural course of the market. After identifying the trend, I move to the 1-hour chart to identify entry points with tighter risk levels.
According to Alex Kuptsikevich, senior market analyst, FxPro, “Using multiple time frames for your trading process can allow traders to align their short-term actions with the larger movements of the market and influence the short-term outcomes of their trades at significantly higher rates of success.” This strategy has reduced my false signals and improved the risk-to-reward ratios of my trades.
I prefer to use the 1-day chart to find key areas of support and resistance and use the 1-hour chart to await confirmation of breakouts. Using the two-time frame approach greatly reduces the number of false breakouts that I encounter due to traders’ overly eager tendencies to jump into trades too quickly; it also allows me to not miss key market movements that occur in line with the overall market trend.

Common Mistakes When Choosing Between Chart Time Frames
Mismatching Time Frames with Trading Goals
Selecting a chart time frame that doesn’t align with your trading strategy leads to poor results. I’ve witnessed many traders use 1-hour charts for long-term investments, missing crucial market cycles visible only on daily charts. Your chosen time frame must match your trading horizon. Day traders need shorter time frames, like 1-hour charts, to capture intraday movements, while position traders benefit from daily charts that reveal macro trends.
Overtrading on Lower Time Frames
The 1-hour chart often triggers excessive trading due to its frequent signals. I fell into this trap during my early trading days, executing too many trades based on hourly fluctuations that proved meaningless on the daily chart. This led to commission costs eating into my profits. Alex Kuptsikevich, senior market analyst at FxPro, notes: “Lower time frames generate more noise and false signals that can trap inexperienced traders in losing positions.”
Ignoring Market Context
Using either time frame in isolation creates a dangerous blind spot in your analysis. The biggest mistake I see is traders making decisions based solely on 1-hour patterns without checking the daily trend direction. Every trading decision should consider multiple time frames. A bullish pattern on an hourly chart carries little weight if it forms against a strong downtrend on the daily chart.
Applying Identical Indicators Across Different Time Frames
Technical indicators behave differently across various time frames. I once applied the same RSI settings to both my hourly and daily charts, resulting in conflicting signals. The 1-hour chart indicated oversold conditions while the daily chart was trending down. To avoid this common mistake, remember to calibrate your technical indicators according to the time frame you are charting.
Failing to Adapt to Market Conditions
Market volatility requires flexible time frame selection. During highly volatile periods, I’ve found daily charts more reliable as they filter out erratic price movements. Conversely, in ranging markets, hourly charts help identify short-term trading opportunities. Your ability to switch between time frames based on current market conditions directly impacts your trading success.
Tools and Indicators That Work Best with Each Time Frame
1-Hour Chart Indicators
The 1-hour timeframe requires specific indicators that can capture shorter-term price movements effectively. Moving averages can be particularly useful when analyzing hourly charts, particularly by using two different simple moving averages with different periods. Using a 13-period moving average with a 26-period moving average helps nail down trends, but gives me very clear crossovers to give me entry and exit signals.
Relative Strength Index (RSI) is another important tool on 1-hour charts. I find this momentum indicator to be particularly useful because it quickly tells me whether or not an asset is overbought or oversold, which is essential to decision-making within these shorter timeframes. If the RSI is above 70 or below 30, I know to watch for reversals, which are not typically visible just from price action.
Daily Chart Indicators
When working within daily charts, I tend to go to indicators that help filter out noise and find the real trend of the market. Moving averages with larger periods are also extremely useful since they smooth price action and help expose the actual larger direction. The 50-day and 200-day moving averages are two staples in my daily chart analysis, functionally creating extremely reliable support and resistance zones.
Volume indicators take on greater significance in daily timeframes. I regularly track volume patterns alongside price movements to confirm trend strength and potential reversal points. High volume during breakouts on daily charts often signals stronger conviction behind the move, making these signals more reliable for my medium to long-term trading decisions.

Combining Timeframe Tools
The most powerful approach I’ve developed involves using complementary tools across both timeframes. I identify the primary trend direction on daily charts using longer-term moving averages and major support/resistance zones. Then I refine my entry timing on 1-hour charts with oscillators like RSI or MACD for precise execution.
As stated by Alex Kuptsikevich, senior market analyst at FxPro, “The time frame you choose should be consistent with the trader’s strategy and risk appetite.” Understanding this concept has changed my trading plan, and I now search for indicators that are consistent across multiple time frames, rather than looking at each chart on its own.
Conclusion: Selecting the Right Chart Based on Your Trading Goals
The debate between 1-hour and 1-day charts isn’t about finding the “better” option but understanding how each serves different trading objectives. I’ve found that successful crypto trading relies on using these timeframes strategically rather than exclusively.
My trading journey has taught me that 1-hour charts excel for precision entries and short-term opportunities, while daily charts provide invaluable context and trend confirmation. By combining both in a multiple-timeframe analysis approach, I’ve significantly improved my decision-making process.
The key takeaway is matching your chart selection to your specific trading goals. Day traders will benefit from the detail of the hourly charts, while position traders should leverage the clarity of daily timeframes. Remember that flexibility in your approach and continuous learning will ultimately determine your success in the volatile crypto market.
